

Instagram isn’t just one of the world’s biggest social networks. It’s also among the best for driving action, with 70% of consumers using the platform for inspiration on their next purchase.
But Instagram isn’t a silver bullet for your marketing strategy. If you’re going to deliver results, you need to constantly analyze your campaigns to understand what’s working (and what isn’t). In turn, you’ll need to identify the Instagram metrics that significantly impact your desired business outcomes.
To help you, we’ve rounded up the top 10 Instagram metrics you should be tracking right now, along with some context about what makes them valuable and — where possible — real-world benchmark data to help you understand your current performance.
Let’s get into it.
1. Total Impressions
What Does It Tell You?
The total number of times your content appeared on Instagram in a given period. If your posts appeared in 500 Insta feeds, you generated 500 impressions. Simple, right?
Why Does It Matter?
In isolation, impressions aren’t super useful because they don’t tell you how many people have actually seen your content. But they give you valuable insight into what the all-powerful algorithm thinks about your content: a sudden spike or downturn in impressions suggests that Insta is showing your posts to more (or fewer) people.
If your impressions go down, it’s a surefire sign that your Instagram strategy needs work.
What Does “Good” Look Like?
We can’t give you a specific benchmark because there are too many variables — from your post volume and frequency to the types of content you share. All we can say is that more is always better regarding impressions!
2. Total Reach
What Does It Tell You?
Whereas impressions speak to the number of accounts you’ve theoretically hit, reach tells you how many people actually saw your posts. Reach is based on the number of unique accounts that view your content, so if the same person sees a post multiple times, it still only counts as a single account reached.
Why Does It Matter?
The whole point of sharing content on Instagram is to reach as many (relevant) people as possible.
What Does “Good” Look Like?
Reach scales with follower count: the more people who follow you, the higher your reach will be (unless you fall foul of the Instagram algorithm and they start restricting your content). So you want the line on your reach chart heading up and to the right.
3. Engagement Rate
What Does It Tell You?
The number of engagements you generate is divided by your total number of impressions.
Why Does It Matter?
Reaching a large number of accounts is one thing; persuading those people to take action—such as liking or commenting on a post—is a far greater challenge. A high engagement rate is a good sign that your followers (and other Instagram users) are enjoying your content, which suggests you understand your audience and what resonates with them. Well done!
What Does “Good” Look Like?
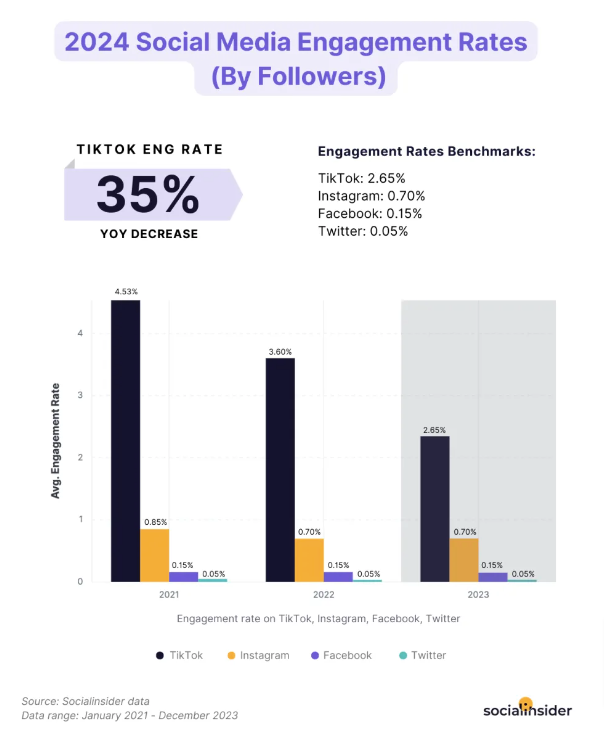
Finally, we can give you a real benchmark to compare your performance against. Instagram has an average engagement rate of 0.7%. Or, a post that gets 1,000 impressions will typically generate seven engagements. Sure, that doesn’t sound great — but it’s way higher than the average engagement rates on Facebook and Twitter:
4. Engagements By Follower
What Does It Tell You?
The average number of times your followers engage with your Instagram content.
Why Does It Matter?
This social media metric excludes all those other Instagram users who might stumble upon your content and focuses solely on the people who care about your brand enough to actually follow you. These people should love your content, so if they’re not engaging, it’s time to tweak your strategy.
Another key point: this metric is vital because engagement rates are closely tied to follower count, with smaller accounts typically enjoying higher engagement. So, if you’ve got 5,000 Insta followers, there’s little point comparing yourself to a brand like Coca-Cola or Nike.
What Does “Good” Look Like?
Generally, we recommend aiming for a by-follower engagement rate of at least double your regular engagement rate. In other words, if your account has an overall engagement rate of 0.7%, your engagement rate by followers should be 1.4%+.
5. Engagements By Reach
What Does It Tell You?
The number of engagements you generate is divided by the total number of people who saw your posts.
Why Does It Matter?
You might think, “Great, yet another way to analyze my engagement rate.” However, engagement by reach is arguably the most important of the three engagement metrics in this article because it shows what happens when people see your posts. If they aren’t liking, commenting, and saving, your content simply isn’t engaging enough.
What Does “Good” Look Like?
Once again, it’s hard to put a specific figure on this. But we can definitely say that your engagement rate by reach should be significantly higher than your engagement rate by followers. To continue our example from the previous section, if your by-follower engagement rate is 1.4%, we’d aim for a by-reach engagement rate of 2.8%+.
6. Comments Received
What Does It Tell You?
This simple metric tells you how many comments you’ve generated over a given timeframe.
Why Does It Matter?
Comments are arguably the most significant engagement type on Instagram. It only takes a fraction of a second to smash “like” or “save,” whereas it requires actual thought to reply with a comment. So, if you’re generating a bunch of comments, it’s a sure sign that your content is provoking some sort of emotional response from your audience.
What Does “Good” Look Like?
We can’t find a reliable comment rate benchmark — probably because most analytics platforms don’t provide separate figures for different types of engagement. So your best bet is to track the number of comments you receive. If it keeps going up, you’re doing something right.
7. Follower Growth Rate
What Does It Tell You?
What it sounds like: how much your follower count has grown (or declined) over a given period.
Why Does It Matter?
Follower count is often dismissed as a meaningless vanity metric. However, one thing’s certain: if your followers are dropping, your Instagram strategy needs work.
What Does “Good” Look Like?
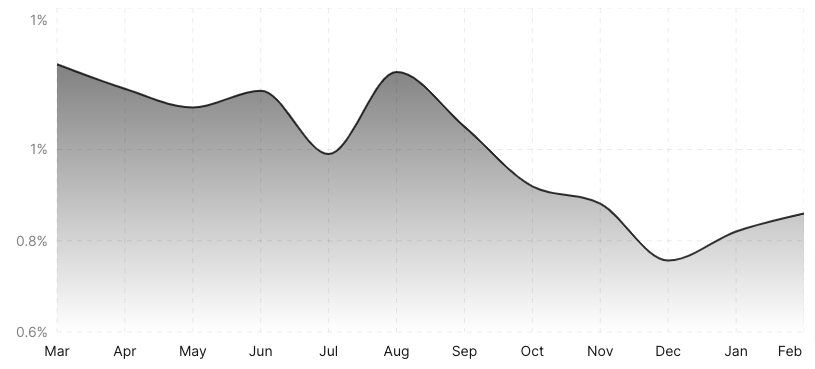
From March 2023 to February 2024, Instagram’s average monthly follower growth rate ranged from 0.77% to 1.2%. However, as you can see, it’s been on a distinctly downward curve throughout that period.
8. Click-Through Rate
What Does It Tell You?
On most social media platforms, click-through rate (CTR) refers to the proportion of people who click links in your posts, divided by your total reach or impressions. But, of course, Instagram doesn’t allow you to include links in posts (well, apart from Instagram Stories). So when we speak about CTR on Instagram, we’re referring to the proportion of people who click through from your bio link after visiting your profile.

Why Does It Matter?
Instagram doesn’t exist in isolation. A high click-through rate suggests you’re posting interesting content on Instagram and inspiring people to learn more about your brand and products.
What Does “Good” Look Like?
Per social media marketing platform Flick, the average Instagram account saw a CTR of 4.7% in the year to February 2024.
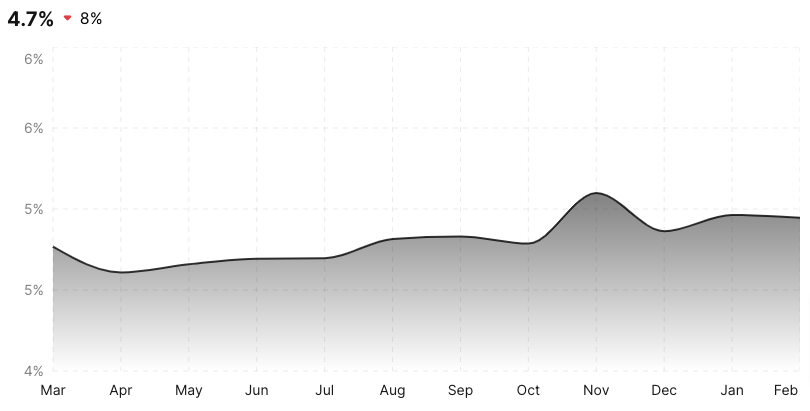
If 1,000 people visit your Instagram profile, about 50 should click through using your bio link.
9. Instagram Reels Shares
What Does It Tell You?
Your Instagram Reels share count is the sum of all the times your Reels were shared on Instagram in a given period, either as Stories or direct messages.
Why Does It Matter?
There are various Instagram Reels-specific metrics, from reach to plays to engagement rate. But we think the most critical measure of Reels’ success is the number of shares generated—because each individual share can have a massive impact on your total reach.
What Does “Good” Look Like?
We can tell you that Instagram Reels have an average engagement rate of 1.23% (that’s higher than any other type of Instagram content).
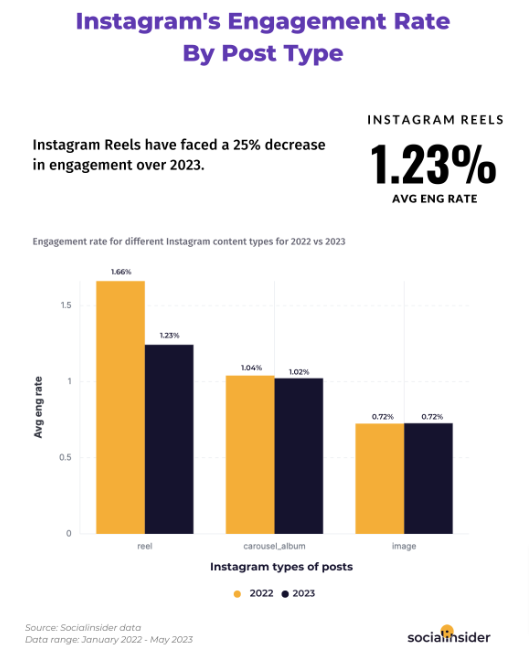
However, we can’t give you a shares-specific benchmark. So your best bet is to track your shares over time, paying close attention to the total number of shares and specific Reels that perform much better (or worse) than average.
10. Instagram Story Completion Rate
What Does It Tell You?
The percentage of people who watch to the very end of your Instagram Stories.
Why Does It Matter?
It’s all too easy to start watching a brand’s Instagram Stories without even realizing it, but sticking around to the end is a clear sign that you enjoyed the content.
What Does “Good” Look Like?
The average Instagram Story completion rate remained pretty static between March 2023 and February 2024 at around 85%:
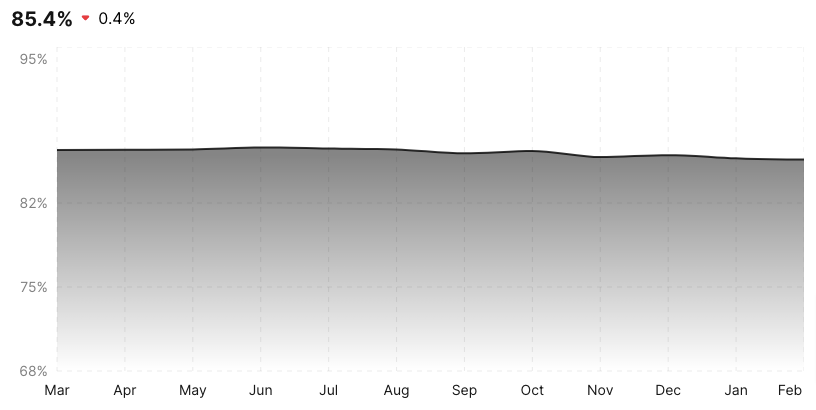
In other words, if 100 people start watching your Instagram Stories, 85+ should watch the whole thing. If your completion rate is significantly below this benchmark, it may be worth examining your content.
Want to learn how smart marketers use metrics like these to improve their social media performance? Sign up for one of our upcoming social media conferences.
Featured image by Pixabay.


